2020 NCAAs: By The Numbers
2020 NCAAs: By The Numbers
A deep dive by the numbers of the 2020 NCAA Wrestling Championshps.

Unlock this article, live events, and more with a subscription!
Already a subscriber? Log In
Yes, we will be missing a pretty big component of what a by-the-numbers article typically analyzes. But no, we won't let that keep us from forging ahead with all the numbers we can think to crunch pertaining the 2020 NCAA Tournament that never was.
Previous NCAAs' By-the-Numbers: 2019 | 2018 | 2017 | 2016 | 2015 | 2014
We've already done some preliminary data slog, based off the list of entries and seeds, which is, unfortunately, all we are going to get in 2020. Kyle tallied the number of qualifiers by school, as well as creating these nifty best lineups based on home states. And your humble blogger got to work on his heat map game as soon as possible, which you can check out here.
My personal favorite heat map from this year's qualifiers is below, but do revisit the article for more details.
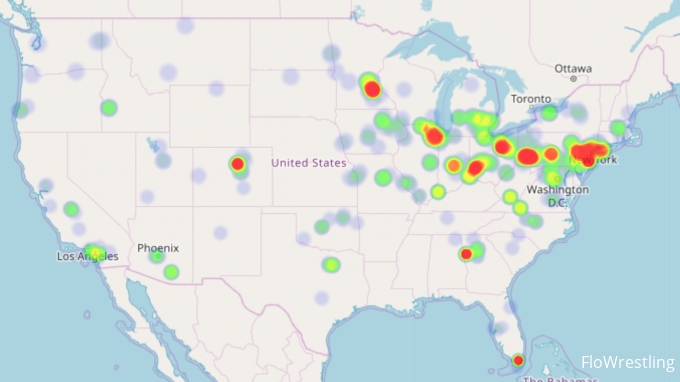
Let's start the new analysis by calculating the team scores based on projected tournament points from the seeds, excluding bonus points.
Tournament Points From Seeds Per School
| RANK | SCHOOL | POINTS |
| 1 | Iowa | 122.5 |
| 2 | Penn State | 76.5 |
| 3 | Ohio State | 66.5 |
| 4 | Northwestern | 47.5 |
| 5 | Nebraska | 46.5 |
| 6 | Oklahoma State | 45.5 |
| 7 | Purdue | 42 |
| 8 | Princeton | 41 |
| 9 | Iowa State | 38 |
| 10 | Minnesota | 36 |
| 11 | Northern Iowa | 35 |
| 12 | NC State | 33.5 |
| 13 | Wisconsin | 33 |
| 13 | Arizona State | 33 |
| 15 | Lehigh | 31 |
| 16 | Stanford | 29 |
| 17 | Cornell | 26.5 |
| 18 | Virginia Tech | 24.5 |
| 19 | Pittsburgh | 24 |
| 20 | Michigan | 21.5 |
| 20 | Central Michigan | 21.5 |
| 22 | North Carolina | 21 |
| 23 | Virginia | 20 |
| 24 | West Virginia | 16 |
| 24 | Campbell | 16 |
| 26 | Oklahoma | 15.5 |
| 27 | Missouri | 15 |
| 28 | Rider | 14.5 |
| 29 | Binghamton | 12.5 |
| 30 | Illinois | 11 |
| 31 | Michigan State | 9.5 |
| 32 | Wyoming | 7 |
| 33 | Utah Valley | 6.5 |
| 33 | South Dakota State | 6.5 |
| 35 | North Dakota State | 5.5 |
| 36 | Army | 5 |
| 37 | Rutgers | 4.5 |
| 37 | Northern Colorado | 4.5 |
| 39 | Navy | 4 |
| 39 | Clarion | 4 |
| 41 | American | 3.5 |
| 42 | Old Dominion | 3 |
| 43 | Penn | 2.5 |
| 43 | Harvard | 2.5 |
| 43 | Fresno State | 2.5 |
| 46 | VMI | 2 |
| 46 | Oregon State | 2 |
| 46 | Lock Haven | 2 |
| 46 | Kent State | 2 |
| 46 | Bucknell | 2 |
| 51 | Ohio | 1.5 |
| 51 | Cleveland State | 1.5 |
| 51 | Cal Poly | 1.5 |
| 51 | Appalachian State | 1.5 |
| 55 | Northern Illinois | 1 |
| 55 | Indiana | 1 |
| 55 | Chattanooga | 1 |
| 55 | Buffalo | 1 |
| 59 | SIU-Edwardsville | 0.5 |
| 59 | George Mason | 0.5 |
| 59 | Edinboro | 0.5 |
| 59 | Drexel | 0.5 |
| 59 | CSU-Bakersfield | 0.5 |
| 59 | Columbia | 0.5 |
| 65 | The Citadel | 0 |
| 65 | Maryland | 0 |
| 65 | Hofstra | 0 |
| 65 | Duke | 0 |
| 65 | Bloomsburg | 0 |
The story all year long was that it was Iowa's title to lose. That assumption is supported by the seeding committee.
Incidentally, 69 different schools qualified a wrestler in the field of 330 total competitors.
How did this year's teams do compared to their recent historical average? We took the average points scored (based on tournament finish with no bonus points factored in. Apologies but we don't have the precise tournament scores handy) from the years 2016-2019 and compared to the expected points based on the 2020 seeds. The final column is the difference between this year and the previous four-year average.
| SCHOOL | 2020 | 4YR AVG | DELTA |
| Iowa | 135 | 70.3 | 64.8 |
| Penn State | 84.5 | 111.0 | -26.5 |
| Ohio State | 77 | 86.9 | -9.9 |
| Northwestern | 57.5 | 10.4 | 47.1 |
| Nebraska | 57 | 43.3 | 13.8 |
| Minnesota | 54.5 | 32.9 | 21.6 |
| Wisconsin | 53 | 22.4 | 30.6 |
| Purdue | 48.5 | 5.1 | 43.4 |
| Lehigh | 47.5 | 32.0 | 15.5 |
| Northern Iowa | 45 | 19.8 | 25.3 |
| Oklahoma State | 45 | 68.6 | -23.6 |
| NC State | 44 | 36.0 | 8.0 |
| Princeton | 43.5 | 15.8 | 27.8 |
| Iowa State | 40.5 | 13.3 | 27.3 |
| Arizona State | 36.5 | 27.5 | 9.0 |
| Pittsburgh | 36 | 4.6 | 31.4 |
| Cornell | 32 | 48.6 | -16.6 |
| Virginia | 32 | 12.9 | 19.1 |
| Michigan | 29 | 47.8 | -18.8 |
| Virginia Tech | 28.5 | 49.8 | -21.3 |
| Central Michigan | 27.5 | 7.0 | 20.5 |
| North Carolina | 25 | 15.1 | 9.9 |
| Stanford | 22 | 11.3 | 10.8 |
| Missouri | 21 | 55.9 | -34.9 |
| Campbell | 20 | 2.9 | 17.1 |
| Rider | 18.5 | 8.9 | 9.6 |
| Illinois | 18 | 32.6 | -14.6 |
| West Virginia | 17 | 3.5 | 13.5 |
| Army | 16 | 2.5 | 13.5 |
| Oklahoma | 16 | 11.8 | 4.3 |
| Binghamton | 14.5 | 1.0 | 13.5 |
| South Dakota State | 14 | 15.6 | -1.6 |
| Michigan State | 13.5 | 2.6 | 10.9 |
| North Dakota State | 11.5 | 2.9 | 8.6 |
| Rutgers | 9.5 | 28.9 | -19.4 |
| Northern Colorado | 9 | 0.9 | 8.1 |
| Wyoming | 9 | 16.1 | -7.1 |
| Harvard | 8 | 0.9 | 7.1 |
| Navy | 8 | 7.5 | 0.5 |
| Utah Valley | 8 | 4.1 | 3.9 |
| Fresno State | 7.5 | 2.8 | 4.8 |
| Old Dominion | 7.5 | 7.4 | 0.1 |
| American | 6.5 | 4.4 | 2.1 |
| Appalachian State | 6.5 | 3.1 | 3.4 |
| Clarion | 6.5 | 0.9 | 5.6 |
| Lock Haven | 6.5 | 14.3 | -7.8 |
| Chattanooga | 5 | 1.0 | 4.0 |
| Ohio | 5 | 2.5 | 2.5 |
| Northern Illinois | 4.5 | 2.6 | 1.9 |
| Bucknell | 4 | 2.5 | 1.5 |
| Drexel | 4 | 1.6 | 2.4 |
| Oregon State | 4 | 14.3 | -10.3 |
| SIU-Edwardsville | 4 | 2.3 | 1.8 |
| Penn | 3.5 | 6.3 | -2.8 |
| Buffalo | 3 | 1.5 | 1.5 |
| Indiana | 3 | 4.6 | -1.6 |
| Kent State | 3 | 9.5 | -6.5 |
| Cal Poly | 2.5 | 0.6 | 1.9 |
| Cleveland State | 2.5 | 0.9 | 1.6 |
| Columbia | 2.5 | 1.4 | 1.1 |
| VMI | 2.5 | 0.0 | 2.5 |
| Bloomsburg | 2 | 0.0 | 2.0 |
| CSU-Bakersfield | 2 | 2.5 | -0.5 |
| Edinboro | 2 | 5.5 | -3.5 |
| Hofstra | 2 | 2.8 | -0.8 |
| Maryland | 2 | 4.9 | -2.9 |
| George Mason | 1.5 | 1.0 | 0.5 |
| Duke | 1 | 11.5 | -10.5 |
| The Citadel | 1 | 0.0 | 1.0 |
Every team was disappointed the NCAAs got canceled, but this illustrates just how painful it must have been for the Hawkeyes and their fans. Purdue, Northwestern, Wisconsin, Princeton, and UNI aren't too far behind on the heartbreak scale.
And just for fun, I made this conditionally formatted table of the top 15 teams in average points scored per weight class over the last five years (still using the NCAA placement and 2020 seeds for point total approximations).
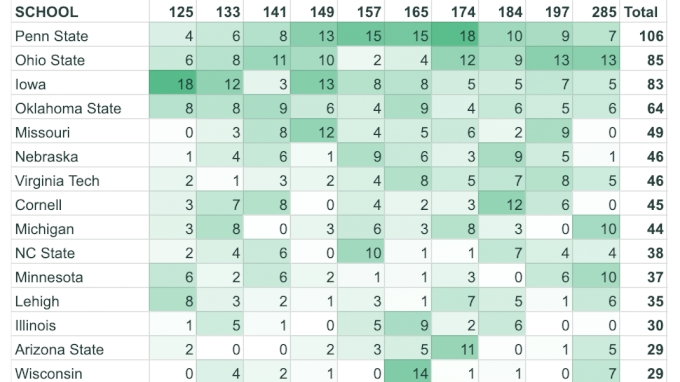
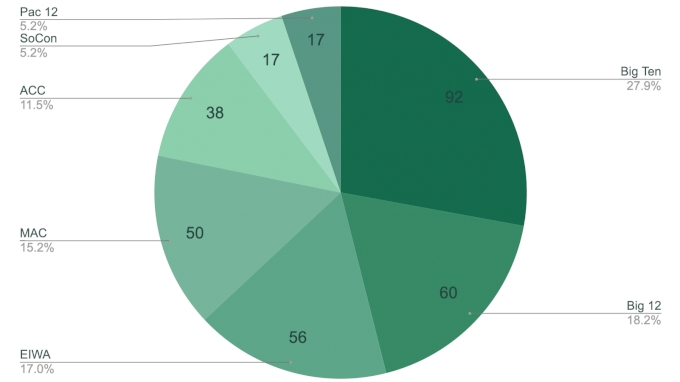
Now's let's break things down by conference. And going forward, when we discuss "points" it will be tournament points derived from the seeds.
National Qualifiers per Conference
| CONF | NQs |
| Big Ten | 92 |
| Big 12 | 60 |
| EIWA | 56 |
| MAC | 50 |
| ACC | 38 |
| SoCon | 17 |
| Pac 12 | 17 |
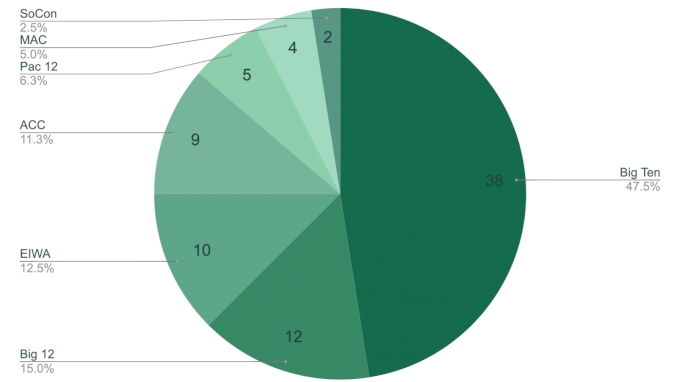
Top 8 Seeds per Conference
| CONF | Top 8 |
| Big Ten | 38 |
| Big 12 | 12 |
| EIWA | 10 |
| ACC | 9 |
| Pac 12 | 5 |
| MAC | 4 |
| SoCon | 2 |
Points per Conference
| CONF | POINTS |
| Big Ten | 518 |
| Big 12 | 182.5 |
| EIWA | 131.5 |
| ACC | 123 |
| MAC | 68.5 |
| Pac 12 | 66 |
| SoCon | 20.5 |
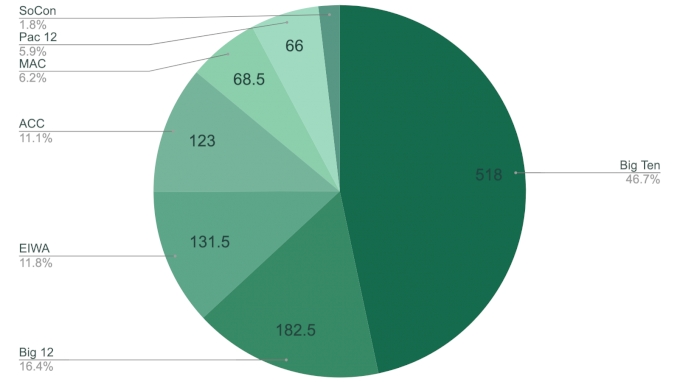
The Big Ten dominated but if you divide those points by the number of teams in each conference, you can see how much power the ACC packs into just 6 programs.
Points per Conference per Team
| CONF | POINTS | TEAMS | PTS/TEAM |
| Big Ten | 518 | 14 | 37.0 |
| ACC | 123 | 6 | 20.5 |
| Big 12 | 182.5 | 12 | 15.2 |
| Pac 12 | 66 | 6 | 11.0 |
| EIWA | 131.5 | 17 | 7.7 |
| MAC | 68.5 | 15 | 4.6 |
| SoCon | 20.5 | 8 | 2.6 |
Now let's do home states.
Qualifiers per Home State
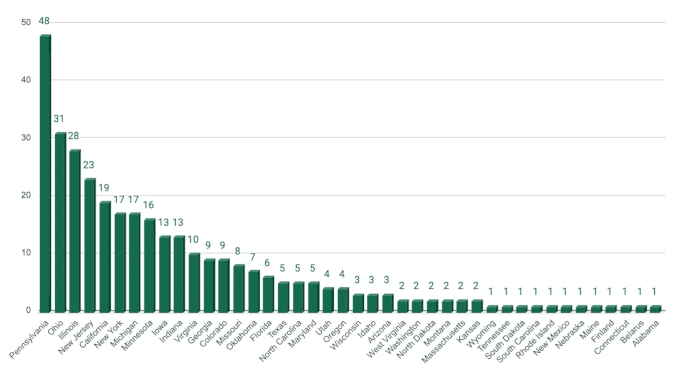
40 different states (plus two foreign countries!) had 2020 NCAA qualifiers. That's too many states for a pie chart, so a simple bar graph will do. The numbers are in the table below.
| STATE | NQs | STATE | NQs | |
| Pennsylvania | 48 | Wisconsin | 3 | |
| Ohio | 31 | Idaho | 3 | |
| Illinois | 28 | Arizona | 3 | |
| New Jersey | 23 | West Virginia | 2 | |
| California | 19 | Washington | 2 | |
| New York | 17 | North Dakota | 2 | |
| Michigan | 17 | Montana | 2 | |
| Minnesota | 16 | Massachusetts | 2 | |
| Iowa | 13 | Kansas | 2 | |
| Indiana | 13 | Wyoming | 1 | |
| Virginia | 10 | Tennessee | 1 | |
| Georgia | 9 | South Dakota | 1 | |
| Colorado | 9 | South Carolina | 1 | |
| Missouri | 8 | Rhode Island | 1 | |
| Oklahoma | 7 | New Mexico | 1 | |
| Florida | 6 | Nebraska | 1 | |
| Texas | 5 | Maine | 1 | |
| North Carolina | 5 | Finland | 1 | |
| Maryland | 5 | Connecticut | 1 | |
| Utah | 4 | Belarus | 1 | |
| Oregon | 4 | Alabama | 1 |
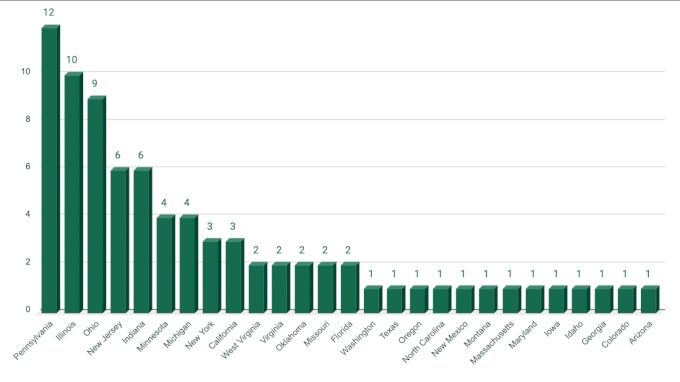
Top 8 per Home State
Points per Home State
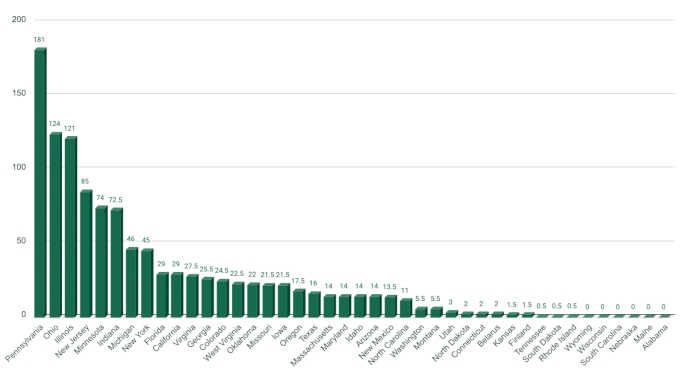
| RANK | STATE | PTS |
| 1 | Pennsylvania | 181 |
| 2 | Ohio | 124 |
| 3 | Illinois | 121 |
| 4 | New Jersey | 85 |
| 5 | Minnesota | 74 |
| 6 | Indiana | 72.5 |
| 7 | Michigan | 46 |
| 8 | New York | 45 |
| 9 | Florida | 29 |
| 10 | California | 29 |
A strong year for Pennsylvania no double. Illinois and Indiana had better than usual seasons as well. Now let's compare the points-based off seasons from 2020 to how these top 10 states did at the NCAAs in the previous four seasons.
| STATE | 2016 | 2017 | 2018 | 2019 | 2020 |
| Pennsylvania | 171 | 154.5 | 230 | 208 | 181 |
| Ohio | 142 | 143.5 | 138 | 79 | 124 |
| Illinois | 70 | 67 | 31.5 | 74.5 | 121 |
| New Jersey | 83.5 | 57.5 | 113 | 155.5 | 85 |
| Minnesota | 27 | 71.5 | 70 | 50 | 74 |
| Indiana | 6 | 18.5 | 47 | 36.5 | 72.5 |
| Michigan | 73 | 58.5 | 50.5 | 70.5 | 46 |
| New York | 43 | 37 | 45 | 65 | 45 |
| Florida | 12 | 5.5 | 7 | 13 | 29 |
| California | 77 | 56 | 65 | 56 | 29 |
Ohio was ready to rebound after an off 2019, Illinois was poised to have perhaps their best season in many years, and New York and Florida both looked ready to have banners years as well. New Jersey was likely to regress back to their mean, while California did not look like they would reach their typical level.
Iowa and Missouri were in the top 10 cumulative tournament points (simulated, not actual) from 2015-2019 but did not crack the top 10 in 2020.
And now, because I am a fan of the per capita calculations, here are the number of 2020 national qualifiers per state per million inhabitants (as of the 2019 census estimates).
2020 National Qualifiers per State per Capita
| State | NQs/1M Pop |
| Iowa | 4.12 |
| Pennsylvania | 3.75 |
| Minnesota | 2.84 |
| Ohio | 2.65 |
| North Dakota | 2.62 |
| New Jersey | 2.59 |
| Illinois | 2.21 |
| Indiana | 1.93 |
| Montana | 1.87 |
| Oklahoma | 1.77 |
| Wyoming | 1.73 |
| Michigan | 1.70 |
| Idaho | 1.67 |
| Colorado | 1.56 |
| Missouri | 1.30 |
| Utah | 1.25 |
| Virginia | 1.17 |
| South Dakota | 1.13 |
| West Virginia | 1.12 |
| Oregon | 0.95 |
| Rhode Island | 0.94 |
| New York | 0.87 |
| Georgia | 0.85 |
| Maryland | 0.83 |
| Maine | 0.74 |
| Kansas | 0.69 |
| Nebraska | 0.52 |
| Wisconsin | 0.52 |
| California | 0.48 |
| New Mexico | 0.48 |
| North Carolina | 0.48 |
| Arizona | 0.41 |
| Massachusetts | 0.29 |
| Connecticut | 0.28 |
| Florida | 0.28 |
| Washington | 0.26 |
| Alabama | 0.20 |
| South Carolina | 0.19 |
| Texas | 0.17 |
| Tennessee | 0.15 |
And now, because of the numbers right in front of me, here's the same calculation but over the last five years.
| State | NQs/1M Pop |
| Pennsylvania | 20.9 |
| Iowa | 19.0 |
| South Dakota | 14.7 |
| New Jersey | 14.2 |
| Ohio | 12.7 |
| Minnesota | 11.2 |
| Oklahoma | 10.9 |
| Illinois | 10.7 |
| Wyoming | 10.4 |
| Michigan | 8.6 |
| Missouri | 8.3 |
| West Virginia | 7.8 |
| Colorado | 7.6 |
| Indiana | 6.7 |
| Oregon | 5.7 |
| Montana | 5.6 |
| Idaho | 5.6 |
| North Dakota | 5.2 |
| Virginia | 4.7 |
| Utah | 4.7 |
| Maryland | 4.5 |
| Kansas | 4.5 |
| Georgia | 4.2 |
| Nebraska | 3.6 |
| New York | 3.6 |
| Wisconsin | 3.1 |
| New Mexico | 2.9 |
| Rhode Island | 2.8 |
| Washington | 2.5 |
| California | 2.4 |
| Connecticut | 2.0 |
| North Carolina | 1.7 |
| Arizona | 1.6 |
| Massachusetts | 1.6 |
| Florida | 1.5 |
| Alabama | 1.0 |
| Tennessee | 0.9 |
| Maine | 0.7 |
| Texas | 0.7 |
| South Carolina | 0.6 |
Just by the by, Virginia Tech's Cody Hughes is the first national qualifier from Maine that I can find any information about. If someone knows of other Maine qualifiers, let us know!
Four-Time Qualifiers
30 total qualifiers were invited to their fourth NCAA tournament (but let us know if we missed anyone). They are, in reverse alphabetical order, because that's what the spreadsheet wats to give me, below:
| NAME | YR | WT | School | Finish/Seed |
| Vincenzo Joseph | SR | 165 | Penn State | 2 |
| JR | 165 | Penn State | 2 | |
| SO | 165 | Penn State | 1 | |
| FR | 165 | Penn State | 1 | |
| Travis Piotrowski | SR | 133 | Illinois | 7 |
| JR | 125 | Illinois | 24 | |
| SO | 125 | Illinois | 16 | |
| FR | 125 | Illinois | 32 | |
| Taylor Lujan | SR | 184 | Northern Iowa | 1 |
| JR | 174 | Northern Iowa | 12 | |
| SO | 174 | Northern Iowa | 12 | |
| FR | 174 | Northern Iowa | 16 | |
| Tanner Hall | SR | 285 | Arizona State | 4 |
| JR | 285 | Arizona State | 16 | |
| SO | 285 | Arizona State | 3 | |
| FR | 285 | Arizona State | 12 | |
| Taleb Rahmani | SR | 157 | Pittsburgh | 23 |
| JR | 157 | Pittsburgh | 12 | |
| SO | 157 | Pittsburgh | 24 | |
| FR | 157 | Pittsburgh | 16 | |
| Seth Gross | SR | 133 | Wisconsin | 2 |
| JR | 133 | South Dakota State | 1 | |
| SO | 133 | South Dakota State | 2 | |
| FR | 141 | South Dakota State | 12 | |
| Russell Rohlfing | SR | 149 | CSU-Bakersfield | 24 |
| JR | 149 | CSU-Bakersfield | 16 | |
| SO | 141 | CSU-Bakersfield | 32 | |
| FR | 141 | CSU-Bakersfield | 32 | |
| Pat Lugo | SR | 149 | Iowa | 1 |
| JR | 149 | Iowa | 8 | |
| SO | 149 | Edinboro | 24 | |
| FR | 149 | Edinboro | 12 | |
| Nick Piccininni | SR | 125 | Oklahoma State | 3 |
| JR | 125 | Oklahoma State | 5 | |
| SO | 125 | Oklahoma State | 12 | |
| FR | 125 | Oklahoma State | 4 | |
| Mitch McKee | SR | 141 | Minnesota | 10 |
| JR | 141 | Minnesota | 6 | |
| SO | 133 | Minnesota | 12 | |
| FR | 133 | Minnesota | 12 | |
| Max Thomsen | SR | 149 | Northern Iowa | 13 |
| JR | 149 | Northern Iowa | 12 | |
| SO | 149 | Northern Iowa | 12 | |
| FR | 149 | Northern Iowa | 5 | |
| Matt Kolodzik | SR | 149 | Princeton | 6 |
| JR | 149 | Princeton | 5 | |
| SO | 149 | Princeton | 3 | |
| FR | 141 | Princeton | 7 | |
| Mark Hall | SR | 174 | Penn State | 1 |
| JR | 174 | Penn State | 2 | |
| SO | 174 | Penn State | 2 | |
| FR | 174 | Penn State | 1 | |
| Luke Pletcher | SR | 141 | Ohio State | 1 |
| JR | 133 | Ohio State | 4 | |
| SO | 133 | Ohio State | 4 | |
| FR | 141 | Ohio State | 16 | |
| Kyle Shoop | SR | 141 | Lock Haven | 20 |
| JR | 141 | Lock Haven | 7 | |
| SO | 141 | Lock Haven | 32 | |
| FR | 149 | Lock Haven | 33 | |
| Kollin Moore | SR | 197 | Ohio State | 1 |
| JR | 197 | Ohio State | 2 | |
| SO | 197 | Ohio State | 4 | |
| FR | 197 | Ohio State | 3 | |
| Josh Shields | SR | 165 | Arizona State | 6 |
| JR | 165 | Arizona State | 6 | |
| SO | 157 | Arizona State | 7 | |
| FR | 157 | Arizona State | 24 | |
| Joseph Smith | SR | 174 | Oklahoma State | 12 |
| JR | 165 | Oklahoma State | 16 | |
| SO | 157 | Oklahoma State | 4 | |
| FR | 157 | Oklahoma State | 7 | |
| Jared Prince | SR | 149 | Navy | 29 |
| JR | 149 | Navy | 12 | |
| SO | 149 | Navy | 32 | |
| FR | 141 | Navy | 16 | |
| Jack Mueller | SR | 125 | Virginia | 4 |
| JR | 125 | Virginia | 2 | |
| SO | 133 | Virginia | 12 | |
| FR | 125 | Virginia | 6 | |
| Devin Skatzka | SR | 174 | Minnesota | 7 |
| JR | 174 | Minnesota | 8 | |
| SO | 174 | Indiana | 32 | |
| FR | 174 | Indiana | 32 | |
| David McFadden | SR | 165 | Virginia Tech | 7 |
| JR | 174 | Virginia Tech | 5 | |
| SO | 165 | Virginia Tech | 5 | |
| FR | 165 | Virginia Tech | 6 | |
| Cole Martin | SR | 149 | Wisconsin | 26 |
| JR | 149 | Wisconsin | 24 | |
| SO | 149 | Wisconsin | 32 | |
| FR | 141 | Wisconsin | 32 | |
| Christian Moody | SR | 125 | Oklahoma | 31 |
| JR | 125 | Oklahoma | 32 | |
| SO | 125 | Oklahoma | 32 | |
| FR | 125 | Oklahoma | 32 | |
| Christian Brunner | SR | 197 | Purdue | 6 |
| JR | 197 | Purdue | 12 | |
| SO | 197 | Purdue | 24 | |
| FR | 197 | Purdue | 24 | |
| Cam Sykora | SR | 133 | North Dakota State | 11 |
| JR | 133 | North Dakota State | 24 | |
| SO | 133 | North Dakota State | 32 | |
| FR | 133 | North Dakota State | 24 | |
| Bryce Steiert | SR | 174 | Northern Iowa | 5 |
| JR | 165 | Northern Iowa | 8 | |
| SO | 165 | Northern Iowa | 12 | |
| FR | 157 | Northern Iowa | 16 | |
| Brock Zacherl | SR | 149 | Clarion | 11 |
| JR | 141 | Clarion | 12 | |
| SO | 141 | Clarion | 32 | |
| FR | 141 | Clarion | 24 | |
| Brandon Womack | SR | 174 | Cornell | 30 |
| JR | 174 | Cornell | 16 | |
| SO | 174 | Cornell | 32 | |
| FR | 165 | Cornell | 8 | |
| Andrew Fogarty | SR | 165 | North Dakota State | 14 |
| JR | 165 | North Dakota State | 16 | |
| SO | 165 | North Dakota State | 24 | |
| FR | 165 | North Dakota State | 24 |
Three-time Qualifiers
29 wrestlers qualified for their third NCAAs in three attempts by earning bids to the 2020 tournament. They will all have a chance to join the four-timers club next year. Worth noting that there are others who have qualified for three NCAAs and still have a year of eligibility that did not wrestle this postseason.
| NAME | SCHOOL |
| Alex Marinelli | Iowa |
| Anthony Valencia | Arizona State |
| Austin DeSanto | Iowa |
| Chad Red | Nebraska |
| Dakota Geer | Oklahoma State |
| Daniel Bullard | NC State |
| DJ Fehlman | Lock Haven |
| Drew Hughes | Michigan State |
| Dylan Duncan | Illinois |
| Eric Schultz | Nebraska |
| Evan Wick | Wisconsin |
| Gage Curry | American |
| Greg Bulsak | Clarion |
| Hayden Hidlay | NC State |
| Jarrett Degen | Iowa State |
| Jordan Wood | Lehigh |
| Josh Heil | Campbell |
| Matt Stencel | Central Michigan |
| Michael Kemerer | Iowa |
| Montorie Bridges | Wyoming |
| Nathan Traxler | Stanford |
| Nick Lee | Penn State |
| Patrick Brucki | Princeton |
| Ryan Deakin | Northwestern |
| Sebastian Rivera | Northwestern |
| Spencer Lee | Iowa |
| Tariq Wilson | NC State |
| Taylor Venz | Nebraska |
| Thomas Bullard | NC State |
Most Returning Points per School
Note: this does not take into account wrestlers that scored points in previous tournaments and have eligibility remaining.
| RANK | SCHOOL | POINTS |
| 1 | Iowa | 102.5 |
| 2 | Northwestern | 47 |
| 3 | Penn State | 40 |
| 4 | Iowa State | 38 |
| 5 | Nebraska | 34 |
| 6 | NC State | 33.5 |
| 7 | Princeton | 32 |
| 8 | Oklahoma State | 30 |
| 9 | Stanford | 29 |
| 10 | Minnesota | 27 |
| 11 | Ohio State | 26.5 |
| 12 | Michigan | 21.5 |
| 13 | Central Michigan | 21 |
| 14 | Purdue | 20.5 |
| 14 | North Carolina | 20.5 |
| 16 | Virginia Tech | 18 |
| 17 | Lehigh | 17.5 |
| 18 | Pittsburgh | 17 |
| 19 | West Virginia | 16 |
| 20 | Oklahoma | 15.5 |
| 21 | Wisconsin | 14.5 |
| 22 | Missouri | 14 |
| 23 | Cornell | 12.5 |
| 23 | Binghamton | 12.5 |
| 25 | Arizona State | 11.5 |
| 26 | Michigan State | 9.5 |
| 27 | Virginia | 7.5 |
| 28 | Wyoming | 7 |
| 29 | Utah Valley | 6 |
| 30 | Campbell | 5.5 |
| 31 | Northern Colorado | 4.5 |
| 32 | Rutgers | 4 |
| 32 | Navy | 4 |
| 32 | Illinois | 4 |
| 35 | American | 3.5 |
| 36 | Northern Iowa | 3 |
| 36 | Army | 3 |
| 38 | South Dakota State | 2.5 |
| 38 | Penn | 2.5 |
| 38 | Harvard | 2.5 |
| 41 | Oregon State | 2 |
| 41 | North Dakota State | 2 |
| 41 | Clarion | 2 |
| 44 | Rider | 1.5 |
| 44 | Old Dominion | 1.5 |
| 44 | Lock Haven | 1.5 |
| 44 | Bucknell | 1.5 |
| 48 | Northern Illinois | 1 |
| 48 | Indiana | 1 |
| 48 | Chattanooga | 1 |
| 51 | SIU-Edwardsville | 0.5 |
| 51 | Ohio | 0.5 |
| 51 | Kent State | 0.5 |
| 51 | Fresno State | 0.5 |
| 51 | Edinboro | 0.5 |
| 51 | Columbia | 0.5 |
| 51 | Buffalo | 0.5 |
| 51 | Appalachian State | 0.5 |
Looks like Iowa is well-positioned for another run at a championship in 2021.
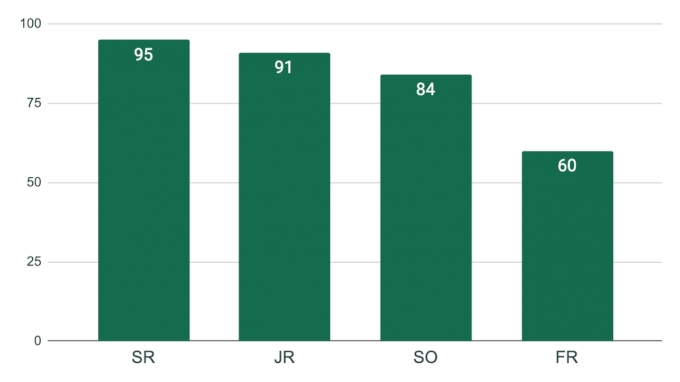
And finally, let's look at qualifiers by class, by typing those words out again, only this time in really big letters.
Qualifiers by Class
| Class | NQs |
| SR | 95 |
| JR | 91 |
| SO | 84 |
| FR | 60 |
